
Read more
Mar 11, 2026
How Data Centers Can Support Grid Resilience During Extreme Weather
Winter Storm Fern offered a real-world test of critical infrastructure flexibility.

Last week's IESO Capacity Auction delivered a wake-up call for Ontario energy markets: prices cleared at $170,000/MW-yr CAD—a staggering 188% increase from last year's $59,000/MW-yr.

Last week's IESO Capacity Auction delivered a wake-up call for Ontario energy markets: prices cleared at $170,000/MW-yr CAD—a staggering 188% increase from last year's $59,000/MW-yr.
This likely isn't just a one-year blip. We believe it is a signal of fundamental shifts in Ontario's energy landscape that will reshape how savvy energy users approach market participation.
The 188% jump resulted from a perfect storm of supply constraints:
The math: While demand grew and existing supply decreased, new supply only added 300 MW—creating a net 400 MW gap year-over-year.
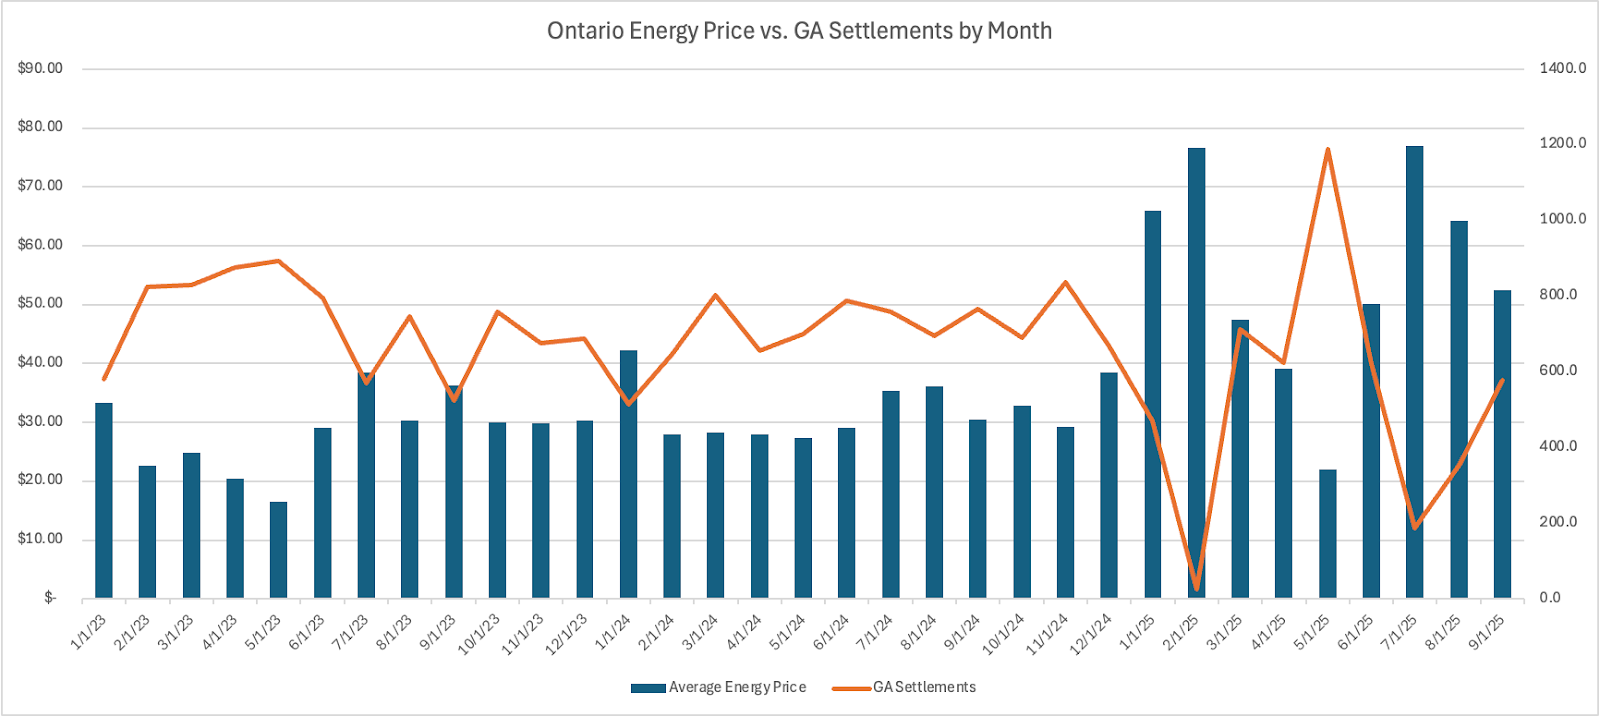
While the capacity auction results grab headlines, they're only part of a larger story reshaping Ontario's electricity markets. To understand what's really happening—and what it means for your energy costs and revenue opportunities—you need to understand the relationship between capacity prices, energy prices, and Global Adjustment (GA) charges.
To understand where Ontario's market is headed, you need to grasp how GA and energy prices interact—and why they're converging.
Think of GA as a bank that balances generator payments:
When energy prices are LOW (below a generator's contract price):
When energy prices are HIGH (above a generator's contract price):
Over the past 15 years, this has created a predictable pattern: Energy prices stayed relatively low while GA charges covered the difference to ensure generators received their contracted rates. Large industrial customers focused almost exclusively on reducing GA peak demand charges.
But that's changing—dramatically.
Several long-term trends suggest this higher pricing environment—and the convergence of GA and energy values—is likely here to stay:
1. Ongoing supply constraints
Ontario continues to face capacity challenges as aging generation retires and electrification increases demand. The nuclear fleet’s on-going refurbishments, including all of the Pickering Nuclear station going offline in January, will further tighten supply in coming years.
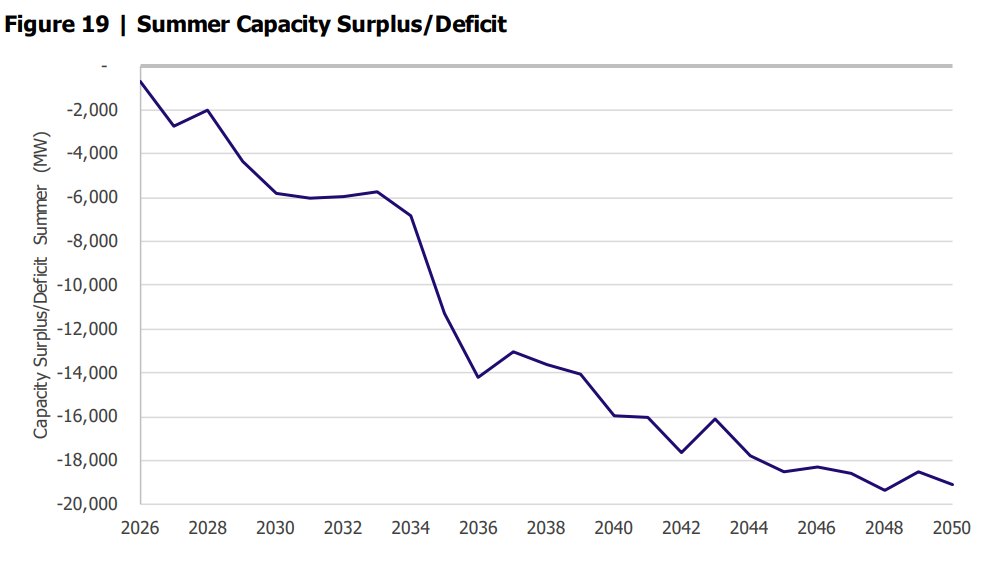
Source: IESO Annual Planning Outlook
2. Growing reliance on imports
The withdrawal of the 300 MW New York generator highlights Ontario's increasing dependence on cross-border capacity. As neighboring jurisdictions face their own supply pressures, import availability and pricing become less predictable. This is a major shift as Ontario has been a net exporter of power for the past 15 years.
3. Day-ahead market structure stabilizes prices, not reduces
Ontario's Market Renewal Program (MRP), which took effect May 1, 2025, shifted IESO to a day-ahead market structure—similar to how U.S. markets operate. Now, generators and DR providers bid into the day-ahead energy market at their marginal cost and are scheduled a day in advance, with real-time used only for imbalances. While this creates more stable energy costs and makes it easier to schedule loads and generators, it has also driven significant price shifts. In the 2025/2026 auction, HDR pricing has increased 100% year-over-year and energy prices are up 100%, while GA pricing dropped 50%.
4. GA continues its downward trajectory
Forward curves show GA prices declining from over $500,000/MW-year in 2019 to projected levels around $195,000/MW-year by 2030. Meanwhile, energy prices are climbing steadily, particularly during peak demand periods.
5. Demand response expansion
Demand side resources are making up a larger percentage of Capacity Market resources this year, expanding from 68% in 2025/2026 to almost 80% in 2026/2027. With generators leaving the market and only a modest increase in DR to compensate for it, there was barely enough capacity to meet the needs of the auction, causing prices to clear at the reference price.
Energy and GA are converging in value for the first time. The traditional focus on GA reduction alone is obsolete. Voltus predicted this convergence—we told customers that both capacity and energy prices would rise, and we were right.
Sites that prioritize Hourly Demand Response (HDR) dispatches can earn energy payments from those dispatches while still capturing an estimated 80-90% of Global Adjustment peak hours. Sites focusing exclusively on GA can miss out on HDR revenue entirely, leaving significant money on the table.
In the 2025/2026 capacity year, HDR was worth the same as one GA peak… now it's worth four GA peaks!
This is why the old approach of managing GA in isolation is obsolete. Winning in today's market requires optimizing HDR and GA together through integrated dispatch optimization. Voltus predicted this market shift months ago and has already adapted our platform to help customers capture maximum value from both revenue streams.
Ready to maximize your energy market earnings? Voltus provides the technology, market expertise, and integrated optimization to help you capture value from both HDR dispatches and Global Adjustment—automatically
.png)